Lesson 15: Dev Processes & Tools
| Homepage | Content | Slides | Video |
Warning
This lesson is under construction. Learn from it at your own risk. If you have any feedback, please fill out our General Feedback Survey.
Code Analysis
Code analysis tools are some of the most important tools in a developer’s arsenal when it comes to finding and fixing bugs. Code analysis tools come in two flavors:
Debugging Tools
Debuggers are interactive dynamic analysis tools that are used to inspect your code as it runs.
- Print (broken) variables.
- Read and reports error messages.
- Highlight (incorrect) syntax.
CLI Debugging Tools
C/C++ Tools
GDB
Valgrind
Python Tools
PDB
NodeJS Tools
node debug
Node Inspector
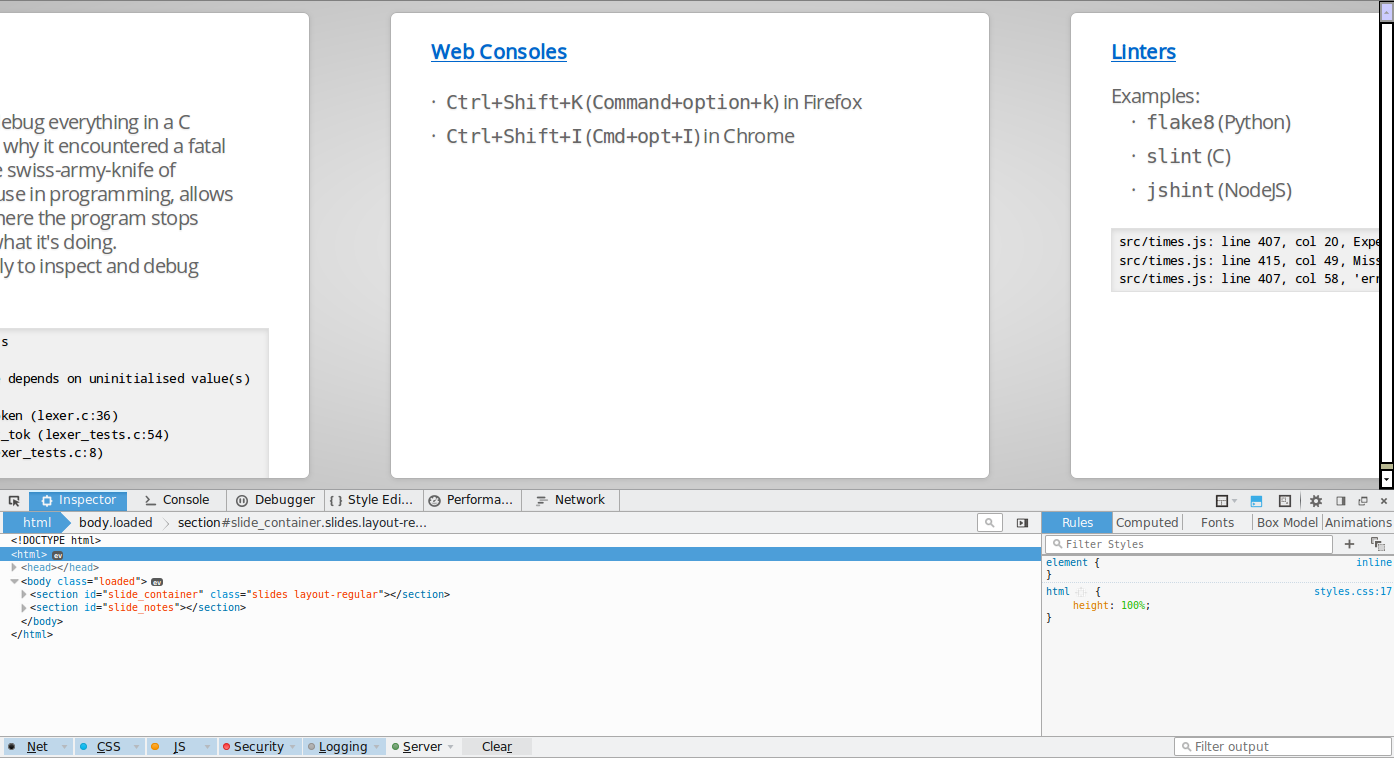
Linters
Linters inspect your code and flags suspicious usage. This can be to enforce a style guide or to flag code which will probably not compile or break the program when it is running.
- Examples:
- flake8 (Python)
- rubocop (Ruby)
- splint (C)
- jshint (NodeJS)
src/times.js: line 407, col 20, Expected '{' and instead saw 'return'.
src/times.js: line 415, col 49, Missing semicolon.
src/times.js: line 407, col 58, 'error' is not defined.
Code Coverage
Name                      Stmts   Miss  Cover   Missing
-------------------------------------------------------
my_program.py                20      4    80%   33-35, 39
my_other_module.py           56      6    89%   17-23
-------------------------------------------------------
TOTAL                        76     10    87%
Integrated Development Environments (IDE)
IDEs are programs used to help developers get their job done by integrating many essential tools into one ecosystem.
- Examples:
- Netbeans (Java)
- Visual Studio (.NET)
- PyCharm (Python)
- Eclipse (Many)
- Atom (Many)
Style Guides
Example: Real-World Style Guides
The Linux kernel style guidelines are actually fun to read:
“First off, I’d suggest printing out a copy of the GNU coding standards, and NOT read it. Burn them, it’s a great symbolic gesture.”
NASA’s Jet Propulsion Laboratory style guidelines are very short and are concerned with automated tooling to do code analysis:
“All loops shall have a statically determinable upper-bound on the maximum number of loop iterations.”
Dependency Isolation
Dependency isolation is the process of – wait for it – isolating the dependencies of a project. This is a surprisingly hard problem and many consider it largely unsolved.
TODO: Python Virtualenvs
Setup and enter the virtual environment.
$ virtualenv <virtualenv name>
New python executable in /path/to/<venv name>/bin/python
Installing setuptools, pip, wheel...
done.
$ source <venv name>/bin/activate
Install a package. This installs it in the current working directory and so does not ask for root permissions.
(<venv name>) $ pip install flask
[...]
To list all packages in the venv:
(<venv name>) $ pip freeze
click==6.7
Flask==1.0.2
itsdangerous==0.24
Jinja2==2.10
MarkupSafe==1.0
Werkzeug==0.14.1
Deactivate (leave) the venv.
(<venv name>) $ deactivate
$
Other Examples
- Node.js:
- Creates a node_modules directory and tracks dependencies in package.json.
- Go:
- Dependencies are tracked via git repositories and using the go get command.
- Rust:
- Dependencies and versions are specified in Cargo.toml. All compiled code (and dependencies) are stored in a target directory.
Development Servers
A Carbon Copy of the Production Environment(s)
Development servers are used to test that your code works in a real environment, with a real server, and real data. You shouldn’t throw your code up on a production website to see if it works, so a development server is as close to the real thing as you can get.
Further Reading
- The Community Ruby Style Guide is a good resource for anybody learning Ruby. It’s the style guide that Rubocop enforces.
- The Official Python Style Guide (PEP8) is a well respected style guide for Python and is commonly accepted as the python style guide.